- Use the tabs along the top of the page to select the level at which you want to view results: the results of the clinical audit can be viewed for individual sites or trusts/boards, or per region/Local Maternity System or country. The level available differs by reporting year. You can change the level selected at any point.
- Select the year you want to view (the most recent year is selected by default).
- Select a subject (measure) from the drop down list.
- Use the drop down list to select a location, or to select ‘All’. You can type a few letters into the box to search for a name or postcode.
- Select any sub-topics/stratifications if applicable using the radio buttons.
- Choose to view a funnel plot (or scatter plot for some measures) or a table.
- Additional contextual information about the selected location can be found underneath the funnel/scatter plot or results table.
Tables
Table data can be exported as an excel file.
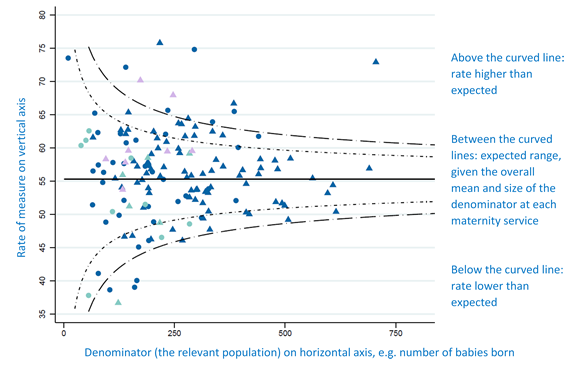
Funnel and scatter plots
Depending on the topic, you can view funnel plots or scatter plots. If one location was selected, this will be highlighted on the funnel or scatter plot. To view the plot without this highlight, select ‘All’.
Clicking on an item in the legend will make this item disappear and appear.
The plots can be printed and downloaded in several image types.
For other ways to view results, see How can I view the clinical results?,
This 2.5 minute video explains how a funnel plot works, or see How does a funnel plot work and what is normal variation?,
